
Well in Excel 2010, Microsoft has introduced small micro charts called “sparklines”. These micro charts aligned with rows of tabular data and often are used to show trends in data.
In the below example I have some sales numbers for the Acme Corporation. For each year I have a sparlkine in column N to graphically represent the yearly sales.

Creating the above sparkline chart is easy as One, Two, Three…
1. First select a blank cell to place the sparkline ( I chose the cells in column N).
2. Go to Insert > Sparkline and select one of three sparkline options (line, column or win-loss).
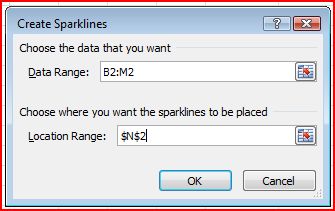
3. Specify the data for your sparkline and where you want the sparkline to be placed.
Finally format the sparkline as desired
No comments:
Post a Comment